By Pew Research,
Christians Decline Sharply as Share of Population; Unaffiliated and Other Faiths Continue to Grow
The Christian share of the U.S. population is declining, while the number of U.S. adults who do not identify with any organized religion is growing, according to an extensive new survey by the Pew Research Center. Moreover, these changes are taking place across the religious landscape, affecting all regions of the country and many demographic groups. While the drop in Christian affiliation is particularly pronounced among young adults, it is occurring among Americans of all ages. The same trends are seen among whites, blacks and Latinos; among both college graduates and adults with only a high school education; and among women as well as men.
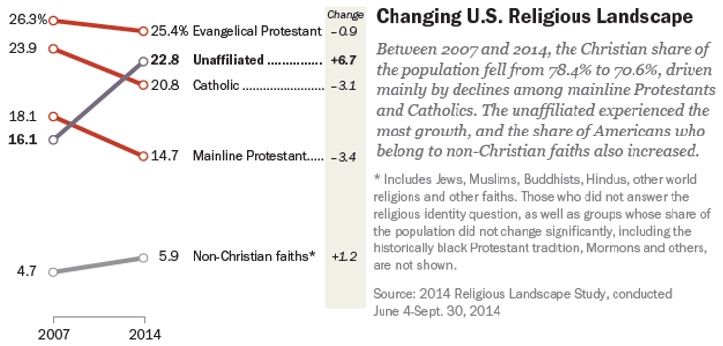
To be sure, the United States remains home to more Christians than any other country in the world, and a large majority of Americans – roughly seven-in-ten – continue to identify with some branch of the Christian faith.1 But the major new survey of more than 35,000 Americans by the Pew Research Center finds that the percentage of adults (ages 18 and older) who describe themselves as Christians has dropped by nearly eight percentage points in just seven years, from 78.4% in an equally massive Pew Research survey in 2007 to 70.6% in 2014. Over the same period, the percentage of Americans who are religiously unaffiliated – describing themselves as atheist, agnostic or “nothing in particular” – has jumped more than six points, from 16.1% to 22.8%. And the share of Americans who identify with non-Christian faiths also has inched up, rising 1.2 percentage points, from 4.7% in 2007 to 5.9% in 2014. Growth has been especially great among Muslims and Hindus, albeit from a very low base.
The drop in the Christian share of the population has been driven mainly by declines among mainline Protestants and Catholics. Each of those large religious traditions has shrunk by approximately three percentage points since 2007. The evangelical Protestant share of the U.S. population also has dipped, but at a slower rate, falling by about one percentage point since 2007.2
Even as their numbers decline, American Christians – like the U.S. population as a whole – are becoming more racially and ethnically diverse. Non-Hispanic whites now account for smaller shares of evangelical Protestants, mainline Protestants and Catholics than they did seven years earlier, while Hispanics have grown as a share of all three religious groups. Racial and ethnic minorities now make up 41% of Catholics (up from 35% in 2007), 24% of evangelical Protestants (up from 19%) and 14% of mainline Protestants (up from 9%).

Religious intermarriage also appears to be on the rise: Among Americans who have gotten married since 2010, nearly four-in-ten (39%) report that they are in religiously mixed marriages, compared with 19% among those who got married before 1960.3 The rise in intermarriage appears to be linked with the growth of the religiously unaffiliated population. Nearly one-in-five people surveyed who got married since 2010 are either religiously unaffiliated respondents who married a Christian spouse or Christians who married an unaffiliated spouse. By contrast, just 5% of people who got married before 1960 fit this profile.
While many U.S. religious groups are aging, the unaffiliated are comparatively young – and getting younger, on average, over time. As a rising cohort of highly unaffiliated Millennials reaches adulthood, the median age of unaffiliated adults has dropped to 36, down from 38 in 2007 and far lower than the general (adult) population’s median age of 46.4 By contrast, the median age of mainline Protestant adults in the new survey is 52 (up from 50 in 2007), and the median age of Catholic adults is 49 (up from 45 seven years earlier).
These are among the key findings of the Pew Research Center’s second U.S. Religious Landscape Study, a follow-up to its first comprehensive study of religion in America, conducted in 2007.
Because the U.S. census does not ask Americans about their religion, there are no official government statistics on the religious composition of the U.S. public.5 Some Christian denominations and other religious bodies keep their own rolls, but they use widely differing criteria for membership and sometimes do not remove members who have fallen away.6 Surveys of the general public frequently include a few questions about religious affiliation, but they typically do not interview enough people, or ask sufficiently detailed questions, to be able to describe the country’s full religious landscape.
The Religious Landscape Studies were designed to fill the gap. Comparing two virtually identical surveys, conducted seven years apart, can bring important trends into sharp relief. In addition, the very large samples in both 2007 and 2014 included hundreds of interviews with people from small religious groups that account for just 1% or 2% of the U.S. population, such as Mormons, Episcopalians and Seventh-day Adventists. This makes it possible to paint demographic and religious profiles of numerous denominations that cannot be described by smaller surveys. The most recent Religious Landscape Study also was designed to obtain a minimum of 300 interviews with respondents in each state and the District of Columbia as well as to represent the country’s largest metropolitan areas, enabling an assessment of the religious composition not just of the nation as a whole, but also of individual states and localities. (See Appendix D.)
The latest survey was conducted in English and Spanish among a nationally representative sample of 35,071 adults interviewed by telephone, on both cellphones and landlines, from June 4-Sept. 30, 2014. Findings based on the full sample have a margin of sampling error of plus or minus 0.6 percentage points. The survey is estimated to cover 97% of the non-institutionalized U.S. adult population; 3% of U.S. adults are not reachable by telephone or do not speak English or Spanish well enough to participate in the survey. (See Appendix A for more information on how the survey was conducted, margins of error for subgroups analyzed in this report and additional details.)
Even a very small margin of error, when applied to the hundreds of millions of people living in the United States, can yield a wide range of estimates for the size of particular faiths. Nevertheless, the results of the second Religious Landscape Study indicate that Christians probably have lost ground, not only in their relative share of the U.S. population, but also in absolute numbers.


Disclaimer: Articles featured on Oregon Report are the creation, responsibility and opinion of the authoring individual or organization which is featured at the top of every article.